
Testing and piloting
But modern efficient technologies for water purification consume a significant amount of electricity. When developing technology At Dyclar, the issue of reducing energy consumption was one of the key issues along with improving efficiency and durability.
The carbon intensity of 1 kWh is 358 g of CO2 (as of 2016). Treatment plants constructions operate 8700 hours a year. eWe will carry out a comparative calculation of energy consumption different technologies.
Request pilot| Parameters | Meaning |
|---|---|
| Flow rate (perfomance), lit/hr | 200 - 500 |
| Inlet pressure, bar | 3...4 |
| Pressure drop in/out, bar | < 1.5 |
| Power consumption, kWt | < 3 |
| Weight, kg | Without water |
| 400 | |
| Dimensions. mm (LxWxH) | 1320 х 740 х 2170 |
| Ambient temperature | +3 С ... +60 C |
| Parameters | Meaning |
|---|---|
| Performance, m3/h | Nominal/Peak 20 m3/h |
| Source Water Pressure, bar | 3÷6 (to be confirmed) |
| Output Pressure Loss, bar | Not more than 1.5 bar (to be confirmed) |
| Drain Waters Amount % of performance |
3÷7% |
| Electrical Energy Consumption | Not more than 30 kW |
| Mass | Empty 14 tons |
| Loaded 22 tons | |
| Demensions. mm (LxWxH) | 12,192 х 2,438 х 2,896 |
| Required Space | 30 m2 |
| Outdoor Climatic Conditions | From -50°С to +50°С |
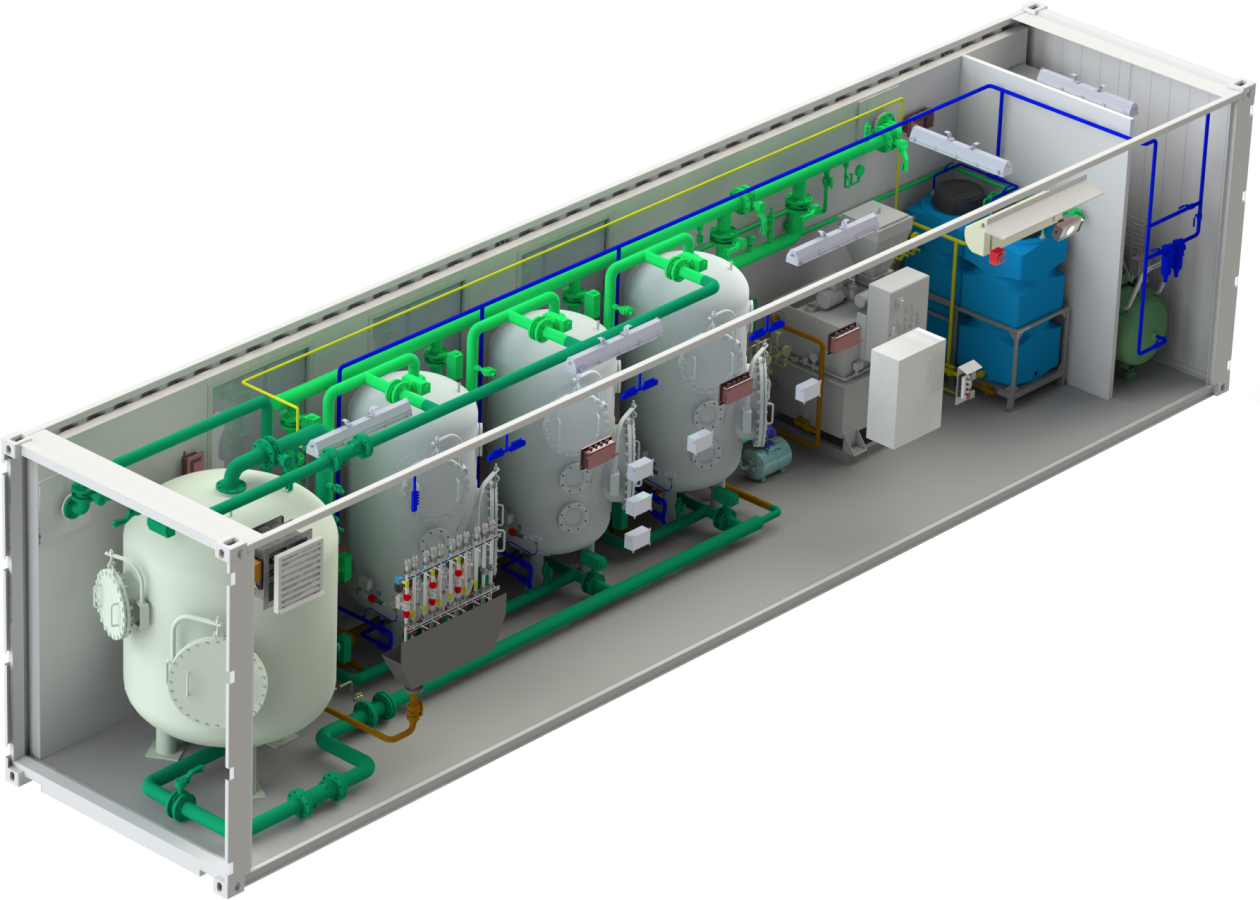
You can test the technology on site using a container unit. Such units do not differ in their performance from stationary plants.
At the same time, they can be mobile, and the nominal production period for these versions is shorter.
| Stages | 1th month | 2nd month | 3rd month | 4th month |
|---|---|---|---|---|
| Internal Devices | ||||
| Units for preparing and dosing reagents | ||||
| Remanifolding the technological workflow and applying anti-corrosion protection |
||||
| Assembly Supervision Works | ||||
| Delivery of Reagents | ||||
| Start-up and Commissioning |
Order of conduct pilot tests
Stage 1
Stage 2
Stage 3
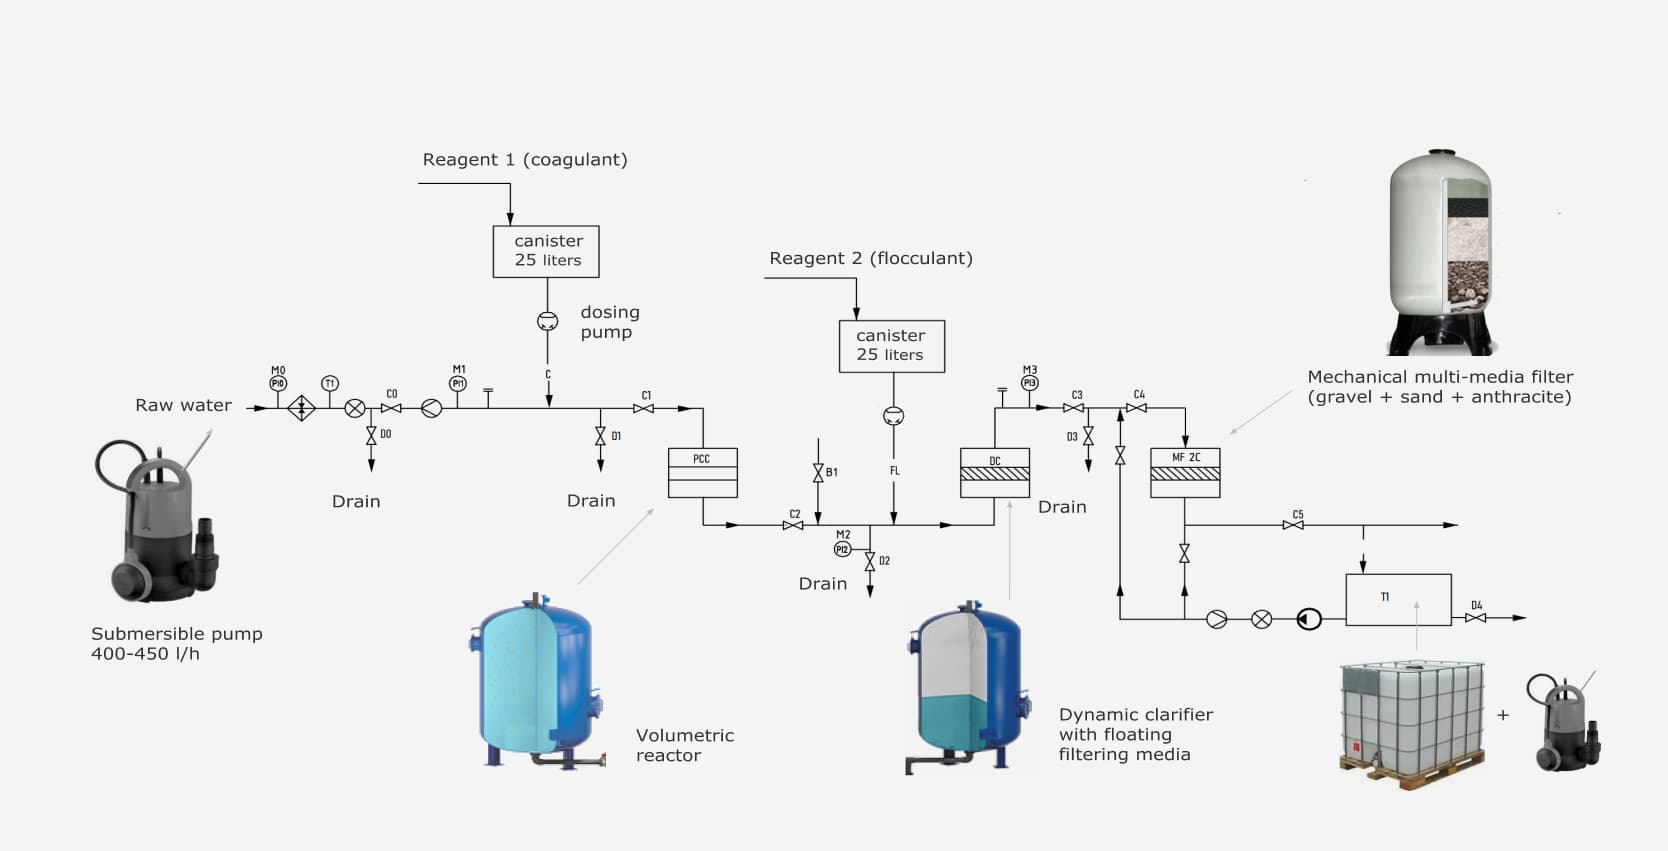
Technological
scheme
Pilot test videos
See allrequest pilot
We are prepared to complete site tests of Dyclar technology within the shortest period. Enter your details below and we will contact you as soon as possible.